The Complete Guide to 5 Stock Market Indicators

What is Stock Market Indicators?
Stock market indicators are primarily used to measure a company’s or economy’s performance. They are also known as key stock indexes that help investors make sound investment decisions. A typical index can be classified into two types- leading and lagging indicators. A leading indicator is an economic phenomenon that affects the financial markets in the short to medium term while a lagging indicator is not influenced by the fluctuating financial markets. Some of the more popular indices include Consumer Price Index, Consumer Confidence Index, Dow Jones Industrial Average, S&P 500 index, and Nasdaq Composite index. These indices provide investors with a general idea of how well their investments are performing and where they should invest their money in the future. Stock market indicators provide an overview of how our economy is doing by measuring its financial stability, growth rate, and other factors that may affect it in the future.
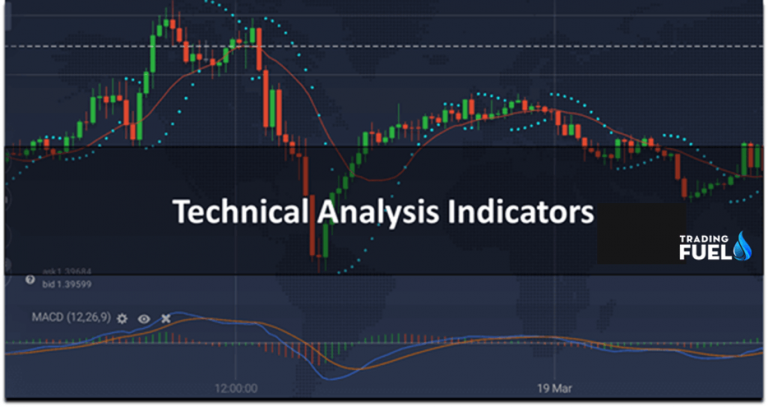
The Use of Indicators in Technical Analysis
 Lagging indicators
Lagging indicators are statistics that measure changes in economic activity and business conditions after they have occurred. They represent the effect of past events on current trends and a shift in direction. The stock market is a lagging indicator. It reflects the economic conditions after it has already occurred. A lagging indicator is a measure of economic activity that changes only after the change in the economy.
Leading indicator
Leading indicator stock market is a term that refers to investments in stocks and other equity securities in anticipation of changes in the economy. The idea behind this is that the stock market will predict what will happen next in the economy. For example, a leading indicator stock market strategy could be buying stocks in technology companies before they launch a new product.
5 Types of Stock Market Indicators
1) On Balance Volume (OBV) indicator
The OBV indicator is a technical analysis indicator that can be used to identify the trend of an asset. It may also be used as a leading indicator, but it must be confirmed by other more reliable indicators.
This is a type of price momentum indicator and it compares a stock’s closing price with the volume at that time. The OBV is plotted on the same chart as the stock and its use can provide traders with valuable information about current investment opportunities and future expectations of prices. The OBV is calculated by first determining both the number of shares (N) traded for any given stock in question, and also the volume (V). To generate an OBV number, simply subtract V from N and divide by N, after which it should be plotted on a graph
2)Relative Strength Index (RSI)
The relative Strength Index (RSI) measures the magnitude and speed of price changes. It is a momentum indicator that applies to stocks, futures, and other asset classes based on daily price changes.
The RSI is derived by comparing the magnitude of recent gains to recent losses over a specified period - typically 14 days. A simple interpretation of the formula for RSI is that it takes into account both the fact that some moves are larger than others, and also how frequently they occur.
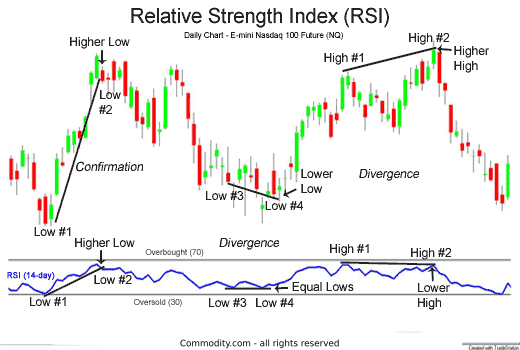
This metric has not been developed for use with short-term trading, but it can be used as part of a longer-term trading strategy to identify overbought or oversold conditions in an asset's price movement.
It is often used when traders are looking for "sell" or "buy" signals because those signals show up more readily on an RSI where the troughs correspond with troughs in an underlying asset's price RSI value will be between 0 and 100, with values near 30 seen as oversold, and values near 70 seen as overbought
3)Market Sentiment
The sentiment in the stock market indicates how people feel about stocks by measuring their expectations about future price changes of stocks and whether stocks are over-priced or under-priced at current times. Market sentiment will affect how people invest in stocks and what they buy straight from companies that are trying to raise money from investors through an initial public offering (IPO) or follow-on offering.
4) Trading signals
Trading signals are a set of indicators that help the trader to make decisions on which stocks to buy or sell. They can be based on technical analysis, fundamental analysis, or a combination of both. Technical analysis is the study of market data and trading activity to forecast future price movements. Trading signals based on technical analysis are generated by using tools such as charts, oscillators, and moving averages.
Fundamental analysis is the study of economic factors that influence the prices of securities. Trading signals based on fundamental analysis can be generated by using tools such as company financials and insider trading data.
5) Moving Average Convergence Divergence(MACD)
Professional traders are always concerned about the opportunity to make a profit from short-term gains as well as long-term investments. The Moving Average Convergence Divergence (MACD) is a trend-following momentum indicator that attempts to identify the point of reversals in a trend and does not provide specific entry or exit signals. This can be done by using the MACD with other indicators like the Relative Strength Index (RSI), Bollinger Bands, and Pivot Points.
The MACD is a versatile algorithmic trading strategy that can be used in any market sector, even commodities such as gold, silver, and platinum. Moving averages can also be adjusted to suit different time frames and broker types, like an online broker vs a full-service broker. A trader's performance is not based on just one indicator alone but rather on all of them together in correlation to each other. Trading success reflects more than just picking winners through research and analysis, it also requires proper money management and position sizing for both long
Conclusion: The Importance of Knowing Stock Market Indicators for Better Investments
There are many factors involved in an investment decision-making process. One of the most important is to be able to decipher the numbers given by stock market indicators. Take a look For additional information Join our Channel for the Trending Trending & Trending These indicators are necessary for a business person as they provide a way of understanding how the stock market is doing, necessary information on how much stocks have increased or decreased, and sometimes even valuable insights into what is going on in the economy. Without these numbers, one may make decisions that are not necessarily advantageous to them and their company.


