Stock Market Analysis: Meaning, Importance, and more

What is Stock Market Analysis?
Stock Market analysis is the process of using mathematical techniques to predict the future direction of a stock. One such technique is known as Fundamental Analysis, which involves looking at financial statements and economic trends to predict price movement. Technical Analysis, on the other hand, looks for short-term price trends based on the trading history of a particular stock. Stock Market Analysis is a type of forecasting model that uses many factors (e.g., revenue and earnings) as input variables and analyzes them mathematically for making predictions about the future values of stocks at a later date (e.g., 1 year from now). In other words, stock market analysts are using past data from these various factors. (e.g., revenue and earnings). Take a look For additional information Join our Channel for the Trending Trending & Trending
Who Needs To Conduct A Stock Market Analysis?
A stock market analysis is a deep dive into the economic and financial aspects of a company. It has been around for decades and it is still one of the most important aspects of investing in the stock market A stock market analysis is an important part of the decision-making process for any investor. It helps in understanding the current market conditions and taking informed decisions. This type of analysis can be done by an investment manager, a financial advisor, or even someone who has no experience in finance at all.
What are some reasons that people would need to conduct a stock market analysis?
- To evaluate the risk level of an investment
- To predict how well a company will do in the future
- To make sure that they are not investing too much money in one company If you are an investor, it is important to know that a stock market analysis may not be as simple as it seems. You will need to have a deep understanding of the markets, which includes knowing about different types of stocks, trading strategies, and risk management techniques.
What are the Different Types of Stock Market Analysis?
The different types of stock market analysis are fundamental analysis, technical analysis, and sentiment analysis. Fundamental Analysis takes into account the value of the asset expressed in the balance sheet statements, while Technical Analysis is focused on past trading actions such as price movement and volume in an attempt to forecast future prices. Sentiment Analysis examines investors' opinions about a particular market or company.
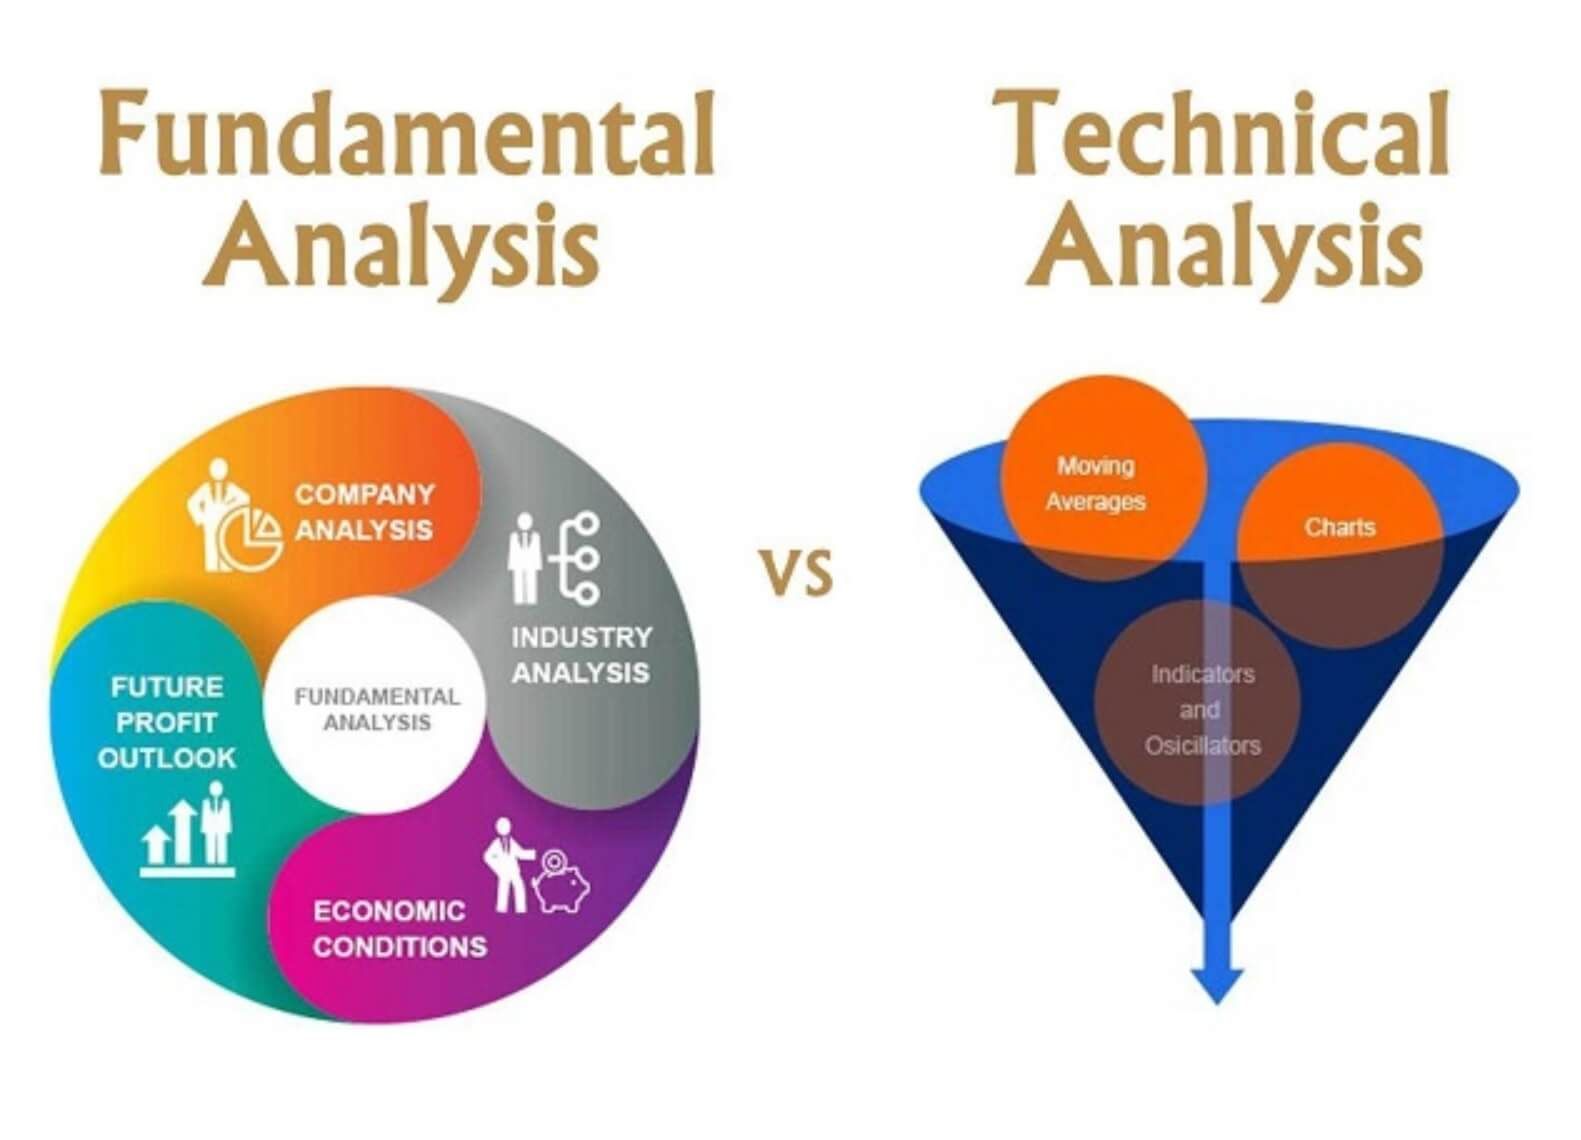
Fundamental Analysis
There are different stock market analysis techniques that traders can use to analyze stocks. Some of the most used are fundamental analysis, technical analysis, chart pattern recognition, and market timing. The technique chosen is often dependent on the trader’s trading style and level. Trading styles can be categorized as either technical traders or fundamental traders. Fundamental analysts examine the basic aspects of a company such as its financial statements, management profile, cash reserves, and dividend rates to assess the company’s value and price. Technical traders study past prices to assess whether they can predict future prices. A small subset of traders also use leveraged ETFs which is equity-based security that tracks an index by using derivatives such as swaps or futures contracts with other investors
Technical analysis
Technical analysis is the process of performing a technical evaluation of an investment, including evaluating the investment's risks and opportunities. Technical analysts are experts that study various aspects of the market to forecast whether it will go up or down. They typically do this by looking at charts, volume, prices, and other factors to determine what is happening in the market. Technical analysts can also work on a tight timeframe like 30 minutes or a day. Technical analysis has many other uses besides forecasting future prices. It can also be used to judge the quality of volume data or identify trends in market data.
Risk-Return relationship as an effective technical form of analysis
In the investment world, a lot of people are now relying on technical analysis to make predictions about the future of financial markets. The risk-return relationship is one of the most effective ways to measure risk. The risk-return analysis is a technique that is used to examine one’s investment risk based on the level of return. In this form of analysis, the investor examines his or her risks by examining the time horizon, the investment horizon, and their precision to measure the return.
This form of analysis has four main steps:
- Calculating a risk-free rate.
- Calculating the market price of an asset.
- Calculating the variance (measurement of stock price changes).
- Calculating a portfolio value using expected rates of return and standard deviations


